The primary sidebar menu is accessed via the Main Navigation icon. It contains three fundamental tabs:
1. Coins Tab
Switch between various market lists using the dropdown menu. You can create custom watchlists using the container button, or delete them via the button.
Use the search input to rapidly locate and filter trading pairs within your active list. Click on the Flag or Coin table headers to dynamically sort your ticker list by category or alphabetically.
2. Objects Tab
The Objects tab houses the complete breakdown of every element attached to your chart (Object Tree). It acts as the central hub for toggling visibility, configuring settings, or permanently deleting specific Indicators and custom Drawings.
3. Data Tab
The Data tab streams exact market values as you hover your cursor over the crosshair in the main chart. It allows you to rapidly inspect precise OHLC (Open, High, Low, Close) candle pricing along with the exact mathematical outputs for all active indicators at that specific historical point.
Navigate the basic layout features before adding complex indicators.
1. Timeframe Selection
Use the timeframe group buttons to quickly switch between different intraday and daily intervals for the active chart.
2. Candlestick Style
Click the button to seamlessly switch chart rendering between Japanese Candles, Heikin Ashi, Line, or other visualization types.
3. Workspace Utilities
Using the menu, save your current active indicators and their customized settings as a template, or load an existing layout instantly.
Any chart modification (adding/removing indicators, changing settings) can be reverted or reapplied via the and buttons without losing work.
Our platform handles unlimited multiple indicators on a single chart with high performance. Adding, editing and managing indicators is highly intuitive and fully responsive via our Object Tree architecture.
1. Adding New Indicators
Click on the designated Indicators button on the top toolbar of the chart. A modal will open presenting the library of built-in indicators and your private script strategies.
Next to an indicator in the list, click the Info (i) button. This opens a detailed breakdown and educational description of how the indicator works, what signals it generates, and its best use cases.
Use the search bar to locate specific tools like MACD, RSI, or custom algorithmic patterns. Click the Add button next to an indicator. It will be instantly painted onto your current active chart.
2. Configuring Indicators
Open the sidebar / Object Tree where all active indicators applied to your chart are listed. You can quickly see their names and underlying parameters.
Hover over the indicator in the Object Tree and click the Gear (Settings) icon. This launches a dedicated settings overlay overriding standard defaults.
Inside the settings modal, modify input variables such as period length, moving average types, or custom script thresholds. Switch to the style tab to tweak line colors, overlay opacities, and rendering configurations in real-time.
3. Managing the Workspace
- Hide / Show: Click the Eye icon in the Object Tree next to an indicator to temporarily toggle its visibility without deleting it.
- Remove Indicator: Click the Trash icon in the Object Tree to completely remove the indicator and clear its calculations from the current symbol memory.
- Indicator Description: You can also access the indicator's documentation sheet by clicking the Info icon in the Object Tree next to the settings button.
- History Controls: docs_sec3_ul4_2
The Strategy panel allows you to build, test, and analyze complex trading logic without writing a single line of code. It is accessed via the Strategy icon on the main sidebar.
1. Building a New Strategy (NEW Tab)
Open the tab. First, define your base Stop Loss (SL) and Take Profit (TP) percentages (e.g., 3%). Then begin adding your entry rules.
To speed up your workflow, utilize the input at the top of the panel. Instead of scrolling through dozens of logic blocks, simply type the name (e.g., "Bull", "Cross", "MACD") to instantly filter the available mathematical criteria.
Before adding a rule, you select its target resolution from the continuous timeline array above the search bar:
3m
5m
15m ...
1h
You have limitless flexibility to string logic universally (e.g., verifying a 3m volatility spike against a massive 1D macro-trend confirmation).
Server Mode Power: If you execute this complex multi-layered strategy using the SERVER engine, the backend cluster will simultaneously download, stitch, and cross-reference all these distinct timeframes with absolute parallel precision.
To enter a LONG position, you combine these rules together. For example:
- Click Add Rule, set timeframe to 3m, select tr main, and choose a parameter such as EMA 50x200 Bull Cross.
- Click Add Rule again, set timeframe to 1h, test against Quantum Flow, and dictate a rule like Signal Line > 0.
Visual Confirmation: When you specify a mathematical condition in the strategy builder window, the corresponding indicator lines and target zones on the actual chart background will dynamically flash or blink. This guarantees you are hooking into the exact graphical element you are physically looking at.
2. Managing Saved Strategies (BUILDED Tab)
Once compiled, strategies appear in the list as overview cards. Each card displays the strategy name, trading direction (🚀 LONG or 🩸 SHORT), associated timeframes (e.g. 3m 1h), total rules, and SL/TP payload.
Each card provides quick action buttons: to Launch/Run, to duplicate the template, and to delete. Once a strategy completes its run, you can press the full-width Show Results bar to view statistics.
3. Launching a Strategy Simulator
Clicking the Play (▶) button opens the Strategy Configuration Modal.
Define how much historical data you want to process by setting Depth (Candles). You can hit the MAX button to request the maximum available history on the server. Next, define Warmup Candles, which silently pre-loads history to accurately format indicators (like moving averages) before playback simulation begins, preventing skewed or unstable early signals.
Configure Intrabar Mode to dictate exact order priority if both SL and TP are hit inside the exact same candle period. Adjust the Close Rule to calculate executions based on absolute candle High/Low wicks, or restrict executions to strictly trigger on the Candle Close timestamp.
- Playback Options: Enable toggles like "Hide historical candles" for charting in real-time suspense, prevent overlapping trades via "One trade at a time", or enforce a minimum candle cooldown period between consecutive trades.
- Memory Filter : If turned active (ALLOW or DENY mode), the engine will cross-reference live signals against your AI Knowledge Base, allowing or predicting trades solely if they structurally map to saved profitable memories.
- Execution Environment: Select WEB mode for fast, local interface simulations, or lock into SERVER mode to process heavy calculations, clustered indicators, or deep memory filters directly onto the backend cluster nodes.
- Target Assets: Click to mass-deploy a single algorithmic thesis against multiple specific crypto-symbols simultaneously.
4. Analyzing Results Hub
Upon clicking Show Results, the entire run dataset loads. The primary hub details the collective success rate. You can inspect individual coins tested (e.g., BTCUSDT, LQTYUSDT) detailing their distinct quantity of trades and Win Rate (%) breakdowns.
From the main strategy results header, you unlock access to structured machine learning tools:
- Bulk Save: Save ALL valid profitable trades structurally directly into your active Memory folder to train your Knowledge Base.
- Cluster Scanner: Launches deep analysis algorithm across the complete results package linking and extracting statistically repeating setups.
Clicking a specific coin inside the Result Hub navigates to its historical ledger. Every single position is itemized with explicit entry/exit pricing, duration stamps, and terminal outcomes ( +3.00% vs -3.00%).
You safely filter outputs via "Wins Only" or "Loss Only". Inside every individual trace, shortcut logic executes exist in the corner:
to find mathematically exact shapes in the past,
to overlay comparisons versus saved memories,
docs_sec4_43d7
When executing a strategy in WEB Mode, your browser turns into an interactive, localized visual simulator. Instead of processing thousands of calculations instantly in the server background, WEB mode physically replays the market timeline frame by frame directly onto your active chart, giving you deep oversight.
1. The Visual Playback Experience
If you toggled "Hide historical candles" during the configuration window, the chart will reset into a completely blank slate. It will begin painting new candles dynamically from the start of your requested sequence, perfectly mimicking the experience of watching a live market unfold and preventing hindsight variance.
As the visual playback timeline advances and price bars close, the moment your indicator intersection rules mathematically align (LONG or SHORT), a visual trade marker will drop onto the live candle. You will see your exact Entry target alongside your algorithmically mapped Stop Loss and Take Profit boundaries locked onto the vertical scale.
2. Simulator Controls
A floating playback widget automatically mounts onto your interface during WEB Mode validations.
You have full authority to command the simulation speed on the fly. You can crank the velocity up to a maximum of 30x speed to blaze through quiet consolidation periods, and instantly drop it back down to 1x when approaching a massive volatility zone to properly track intrabar actions.
You can hit Pause (⏸) at any given millisecond. This allows you to freeze time entirely. You can slowly scroll back across the chart, pull open the Data Tab window from the Main Sidebar, and review the exact decimal readouts of your indicators the minute before a trade decided to open or hit a Stop Loss.
3. Why utilize WEB Mode?
SERVER mode is engineered for raw mathematical power, capable of scanning a strategy across 100+ separate coin histories in 30 seconds. In contrast, WEB Mode is built for psychological confidence and logic debugging.
- It allows you to identify subtle edge-cases where an indicator might cross just slightly too early on a high wick versus a candle close.
- It lets you verify that specific complex settings like "Intrabar Mode" are physically tracking intra-candle movements correctly.
- It gives you complete trust in the underlying robotic automation by allowing you to manually watch it trade successfully over a vast timeline.
When executing validations in SERVER Mode, the mathematical calculation workload is completely offloaded from your local browser and distributed to our backend cluster worker nodes. This architecture allows for massive, lightning-fast multi-asset historical processing that your computer couldn't handle on its own.
1. The Backend Engine
As soon as you launch a server-side test, your strategy payload is packaged into a JSON blueprint and pushed to a remote queue. Available worker nodes lock onto the job, instantly request giant historical datasets from the database, and crunch the data using optimized binary operations without freezing your web layout.
You do not need to keep the webpage open! SERVER runs independently. Upon completion, the worker pushes the results straight to your Trade Memory Logs and silently updates the status. If enabled, the system can even dispatch a Firebase Web Push notification to your browser alerting you that a giant 100-coin bulk strategy simulation has finished.
2. Multi-Timeframe (MTF) Data Stitching
One of the most complex tasks handled by the SERVER backend is precisely aligning mathematical logic across multiple timescales (e.g., checking a 1h MACD rule alongside a 3m Entry crossover) without data pollution or look-ahead bias (peeking into the future).
The system intelligently scans your logic list and identifies the smallest timeframe explicitly used in your strategy (e.g., 3m). This becomes the "Base Timeline" and drives the simulation tick-by-tick. The SERVER node processes time forward frame-by-frame starting entirely on this anchor.
When the engine arrives at a base candle (say, 14:15 on the 3m chart) and suddenly needs to evaluate an intersection rule from a higher timeframe (e.g., 1h), it does NOT simply load the nearest higher candle. Instead, under the hood, it deploys an ultra-fast algorithm to find the mathematically LAST COMPLETELY CLOSED candle on the 1h timeframe dynamically aligned identically before the 14:15 timestamp.
By strictly referencing previous functionally closed candles using backend unix-timestamps, the server completely eliminates "repaint leaks." You will never accidentally trigger a rule early using higher timeframe data that technically hasn't closed in reality yet.
As trades open and close based on these multi-threaded cross-time calculations, the SERVER Engine bundles every single timeframe's internal variables into a unified memory state for the database (saving exact values of the 15m SMA alongside the 1D RSI the second the trade fired). This guarantees that when examining the Result Hub later, you see exactly what the robot saw across all macro views simultaneously.
Cluster Analysis is an advanced neural feature that scans your entire strategy backtest results to automatically discover highly profitable, repeating mathematical intersections. It transforms raw data into reusable trading intelligence.
1. What exactly is a Cluster?
A Cluster is a deep mathematical footprint representing the exact geometric positioning of historical candlesticks. Behind the scenes, the system transforms price action into a massive 700-point data vector. This vector maps exactly where the candles were located relative to each other, their exact distance from multiple Moving Averages (EMA 5, 13, 50, 200), their divergence metrics, and their precise location inside standard deviation volatility clouds.
Unlike a generic saved trade, a Cluster is dynamically generated by grouping multiple winning trades that share an almost identical candlestick arrangement. The neural engine merges thousands of historical candle setups and extracts only the specific overlaps that consistently meet your required minimum win-rate percentage limit.
2. Multi-Timeframe Weighting (Crucial Feature)
The cluster system allows you to decouple your mathematical entry triggers from the macro visual layout using custom weighted similarity (e.g., 3m, 30m, 1h, 4h).
When analyzing or testing against a Cluster, you can assign custom percentage weights across different timeframes totaling 100%. The system will measure the geometric similarity of the live market candles based entirely on your custom weighting configuration.
Imagine you have a highly profitable 1-Hour candlestick arrangement saved as a Cluster. You can assign 100% weight exclusively to the 1h timeframe in your group settings. During live trading, your strategy might execute an aggressive entry trigger on the lightning-fast 3m timeframe (e.g., a 3m Challenger exit or MACD cross). However, the engine will only allow that 3m trade to open if the macro 1h candles currently look exactly like your saved 1h Cluster arrangement. This provides zero-latency entries strictly when macro conditions are perfect.
3. Launching the Neural Scanner
Inside the Strategy Results Hub, click the dedicated Cluster button:
Find repeating WIN clusters
Because analyzing repeating 700-point geometric vectors across thousands of trades is incredibly intensive, this calculation is immediately offloaded to our dedicated cluster_worker.js backend nodes, ensuring your browser remains lightning fast while the server extracts the golden setups.
The clustering process is an inherently intensive computing task, as each winning trade (WIN) must be mathematically compared against every other winning trade. The algorithm has a quadratic complexity (O(N²)).
For example:
When analyzing 134,565 trades (of which 68,109 were WIN), it required examining over 2.3 billion combinations. This process took approximately 1 hour 20 minutes.
Based on this, calculating clusters for 80,000 WIN trades will take an average of about 2 hours. This value is an estimate: the actual time can be faster or slower depending on the scale of your parameters (Threshold, Pass Rate, Min Matches) and the current load on the computing servers.
4. Saving Clusters to Memory
Once the backend worker finishes compiling the optimal overlaps, you can review the generated Clusters. The most powerful aspect is that you can save an entire Cluster directly into your active Trade Memory, exactly as you would save a single manual trade.
Look for the Memory symbol inside the interface:
5. Utilizing Saved Clusters
Once a high-probability Cluster is securely stored in your Neural Knowledge Base, it unlocks massive automation capabilities.
When running future Strategy simulations, you can enforce strict Memory Filters. By utilizing Data Thresholding:
The engine will cross-reference every new potential trade against your saved Clusters, only validating entries whose geometric candle positioning perfectly match these historically dominant groups. This massively trims out false signals.
Because Clusters exist in memory, you can transition them from historical backtesting into live forward execution.
Alerts
Navigate to the Alerts tab to bind your saved Clusters to real-time notification streams. If the live market data suddenly aligns with your saved Cluster's mathematical overlap, the platform will instantly ping you across your connected devices, allowing you to catch the golden setup as it forms.
Visual Patterns represent one of the most powerful and flexible analytical layers of the system. Instead of rigidly coding rules (e.g., "RSI must be above 70"), you physically select and save the exact geometric shape drawn by any indicator on the chart, and the engine will mathematically scan the market to find matching structures.
1. Core Mechanics & Mathematical Engine
Under the hood, our custom pattern_core mathematics engine evaluates geometric similarity by calculating both Mean Absolute Error (for absolute numeric alignment) and the Pearson Correlation Coefficient (to match structural "hills" and "valleys"). This hybrid scoring guarantees the found pattern not only sits at the correct mathematical altitude, but physically mimics the saved visual trajectory.
The system is incredibly rigorous when evaluating shapes involving multiple indicator lines interacting with each other. For example, if your saved Pattern captures a MACD line crossing ABOVE its Signal line, the Neural Engine deploys an absolute Crossing Penalty. It will punish and reject any live visual match unless those two specific lines also physically intersect in the exact same direction and relative coordinate space.
2. Multi-Indicator Flexibility
You can capture ANY graphical element printed across your layout. You can save the exact shape of localized price candles, the curvature of a custom Moving Average envelope, or the intricate micro-oscillations of a complex custom script. There are zero limitations on which datasets can be vectorized.
You can build a sophisticated visual pattern combining multiple distinct indicators simultaneously (e.g., matching the curve of an RSI combined closely with the shape of Price Action). When doing so, you have granular authority to assign a specific percentage weight to each component. You might allocate 80% importance to the Price structure, and only 20% importance to the RSI slope. The Harmonic Mean algorithm aggregates these into a final singular score, ensuring the total weight sums perfectly to 100%.
3. Deploying Verified Patterns
You can directly inject your saved Visual Patterns inside the Strategy engine as mathematical entry/exit rules. Open the Strategy Panel:
When writing your condition logic, instruct the system to execute a buy order only when the live market trace achieves a high correlation match identical to your captured desktop drawing.
Visual Patterns can be weaponized to instantly scan and rank multiple market sectors.
SORTING
Launch a mass verification job to mathematically sort dozens of coins simultaneously based entirely on their current correlation to your saved custom shape (e.g., finding the top 5 assets out of 100 currently forming your identical localized 'Cup and Handle' trajectory).
Just like Data Clusters, saved Visual Patterns can be attached directly to Live Alerts.
ALERTS
The platform's neural infrastructure will continuously monitor the live data feed in the background. The split-second that your indicator lines organically curve and cross to successfully match your stored visual fingerprint, an automated ping will be delivered across all attached devices.
The Trade Memory system acts as your personal trading encyclopedia. It allows you to save, categorize, and recall entire chart situations (candlestick arrangements + indicator metrics) for future analysis. Access it via the main sidebar:
1. Accessing Trade Memory
Open the memory panel by clicking the Memory icon on the main sidebar:
Here, you can create custom knowledge base folders, review past saved winning setups, and organize historical data points that serve as filters for automated execution.
2. Finding Similar Situations (On-The-Fly Search)
The true power of Trade Memory lies in its ability to instantly cross-reference the live market against your saved database.
While analyzing any chart, click the Find Similar Situations button on the top toolbar:
The algorithmic engine will instantly vectorize your current viewing window across multiple timeframes (3m, 30m, 1h, 4h). It then fires this data to the backend, comparing the current, real-time geometry to every single trade you've ever stored in your Memory folders.
Within seconds, a floating modal will display all historical matches. You'll see previous setups that look identical to the current one, scored by a Percentage Similarity (e.g., 85%). The system will clearly display whether the historical outcome of that specific shape was a WIN or a LOSS, giving you deep statistical insight before you place a live order.
3. Contextual Search within Strategy Results
Inside the Strategy Results hub, next to every executed individual trade, you will find shortcut buttons. Clicking the search icon () next to a past trade will instruct the engine to scan your memory solely for shapes similar to that precise historical moment. This allows you to verify if a random winner was actually part of a larger repeating pattern.
You can also use the comparison icon () to manually select a saved Visual Pattern and aggressively overlay it against any trade. The engine overlays the vectors dynamically, calculating Mean Absolute Error and Pearson Correlation to visually prove exactly why an entry succeeded or failed structurally.
The Data Thresholding module is an incredibly fast, server-side market screener. Instead of staring at one chart, you can instruct the backend to scan the entire market (over 1000+ coins) simultaneously for extremely specific mathematical setups, outputting only the assets that perfectly align with your checklist.
1. Building Sorting Rules
Click the Data Thresholding icon on the main sidebar to open the screener panel. Proceed to add a new condition.
The rules automatically inherit the precise parameters of the indicator currently loaded on your chart (e.g., a custom 14-period RSI vs a 7-period RSI, or entirely bespoke JavaScript indicators). Furthermore, you are not limited to generic outputs. You can select exactly which internal line of an indicator you want to listen to (e.g., instructing the system to track a custom MACD Histogram separately from its Signal line).
Apply mathematical constraints such as Greater Than (>), Crosses Above, Enters Zone, or Touches Check. You then compare the indicator's output against a fixed number, a percentage distance, a specific price candle structure, or even another indicator's line dynamically.
2. Advanced Sorting Conditions
You can create branching logic natively. For example, instruct the engine to find coins where "RSI is above 70 OR the MACD is crossing up." Only one valid branch is required to trigger a successfully matching symbol.
By default, rules scan the current live candle timeline. However, you can add an Offset Range (e.g., 5 candles). This allows the system to fetch coins where the specific valid setup (like an EMA crossover) occurred at any point within the last 5 candles, rather than demanding it happen exactly right this instant.
3. Server-Side Execution & Review
Once your rules are activated, the frontend submits the logic blueprint to our isolated backend evaluating API. Because all recent indicator histories across 1000+ assets are aggressively cached in the server's working memory buffer, your rule check evaluates mathematically in milliseconds. The SORTED tab instantly populates with the winning target coins without freezing your local browser.
For maximum precision, link your Data Thresholding results through the Memory Filter toggle. Before a coin is allowed into your SORTED list, the server will take its active geometric shape and perform a deep Neural Scan against your saved Trade Memory. If the shape doesn't match an old, profitable historical trade, the symbol is rejected and filtered out entirely.
Everything built inside Data Thresholding can seamlessly be exported to live background bots. Navigate to the ALARMS tab to attach these multi-layered screening rules to constant backend tracking workers, delivering Push and Telegram notifications to your phone the millisecond a new coin aligns.
The Alarms Hub is the central control room for all asynchronous background monitoring. Every rule, price trigger, indicator crossover, or complex clustered setup you define is tracked constantly on our backend. Access it using the bell icon:
1. Accessing the Alarms Hub
Open the comprehensive tracking menu by clicking the Alarms icon on the sidebar:
This interface is divided into ALERTS (your active, ongoing monitors) and LOG (a chronological history of triggered events with unread badges, keeping you updated even if you've been offline).
2. Multi-Category Filtering
Your alerts are not thrown into a chaotic single list. The system natively categorizes them into four distinct groups for easy management:
• Price trigger (Simple horizontal/vertical line intersections)
• Indicator alarm (Specific single-coin metric crossovers)
• Strategy (Full algorithmic strategy entries/exits)
• Sort alarm (Market-wide Data Thresholding hits)
3. Granular Notification Control
You can instantly mute or enable Web Sound and Push Notifications globally via checkboxes at the bottom of the tools panel, or perform granular overrides per category. For instance, you could instruct the platform to only trigger Push notifications for executed Strategy alarms, but only play a web sound for simple Price triggers, ensuring you are never spammed.
Because monitoring happens entirely server-side via persistent workers, you do not need to keep the Plotwise application open. The moment an alert condition is met, the backend dispatches notifications directly to your connected devices via Web Push and Telegram instantly.
4. Automated Forward Testing
You can instantly transform any passive alert into an active, automated paper-trading bot. Click the Forward Testing icon on an alarm:
This binds the alert to the Forward Tester module. The moment the backend fires this alarm, the system will automatically open an isolated simulated trade on that specific coin, applying your predefined Stop-Loss (e.g., fixed percentage or ATR distance) and Take-Profit rules, tracking the real-time execution result silently in the background.
Forward Testing transforms your backtested strategies into live, real-time paper-trading bots. Instead of analyzing historical data, the system monitors live market feeds 24/7 and automatically opens isolated simulated trades the moment your alarm conditions align — tracking each position against predefined Stop Loss and Take Profit rules in real time. No real money is at risk.
1. Activating Forward Testing
Navigate to the Alerts panel and locate the alarm you wish to forward-test. On the alarm row, click the Forward Testing icon:
This opens a dedicated configuration panel where you define how the system should execute simulated trades when this specific alarm fires. Each alarm gets its own independent FT configuration — direction, SL, TP, auto-open, and notification channels are all scoped per alarm.
Once configured and saved, the pipeline works as follows: your alarm monitors the market continuously on the backend. The moment it triggers on a specific coin (e.g., the RSI crosses above 70 on BTCUSDT), the Forward Tester automatically opens a simulated position at the current market price. From that point, the monitoring engine recalculates the SL/TP levels on every new candle until the position is closed. This all happens silently, with zero manual intervention, even if you are offline.
2. Configuring Stop Loss & Take Profit
Each Forward Testing configuration is locked to a single direction. Choose between:
LONG
SHORT
The Stop Loss determines when a losing position is automatically closed. There are three configurable modes:
• Fixed % — A simple percentage distance from the entry price (e.g., 1.5%). The stop level is fixed at position opening and never moves.
• Indicator — Lock the SL to a live indicator output. For example, bind it to the ATR (Average True Range) — the stop level will sit at ATR × your custom multiplier below (for LONG) or above (for SHORT) the entry price. You select the indicator, the specific output line, and a distance multiplier.
• Dynamic — Build a complex conditional rule using the same condition builder as the Strategy engine. The position will be closed when the dynamic condition evaluates to TRUE on the live market — for example, when the MACD Signal line crosses below zero. This allows fully algorithmic exits.
The Take Profit defines when a winning position is automatically closed. Four modes are available:
• Fixed % — A fixed percentage target from the entry price (e.g., 3%).
• RR (Risk-Reward) — Set the TP as a multiple of the Stop Loss distance. If your SL is 1%, an RR of 2.0 means the TP is automatically set at 2% profit.
• Indicator — Link TP to a live indicator output, just like the indicator SL mode. Select the indicator, output line, and multiplier.
• Dynamic — Build a conditional rule — the position closes when the rule fires TRUE. Ideal for trailing exits or momentum-based take profits.
Toggle the \"Auto-open positions\" checkbox to control whether the system should automatically open a new simulated trade when the alarm fires. If disabled, the alarm still triggers and logs the event, but no FT position will be opened. This is useful when you want to monitor results without actively accumulating trades.
3. The Forward Testing Dashboard
At the top of the Forward Testing page, use the direction filter buttons to narrow your view:
Each alarm with an active Forward Testing configuration appears as a visual card. The card displays: alarm name, trading direction (LONG/SHORT), associated timeframe badges, total rule count, SL/TP mode badges (e.g., SL:1% TP:2R or SL:Dynamic TP:Dynamic), and a compact rules preview showing the exact conditions the alarm checks. Click the ⚙️ Settings gear icon on any card to open the FT configuration panel.
Below the alarm cards, the system renders an aggregate performance dashboard computed from all completed trades:
• Total PnL — Cumulative sum of all closed trade profits and losses, displayed as a percentage.
• Win Rate — Percentage of profitable trades out of all completed trades, with a win/loss counter (e.g., 12W / 5L).
• Equity Curve — A real-time line chart (powered by ECharts) plotting cumulative PnL over time. This curve grows with every new completed trade, giving you an instant visual health check of your strategy's forward performance.
4. Trade Management
Under each alarm card, all currently open FT positions are listed in real time. Each trade row shows the symbol, direction (LONG/SHORT), current unrealized PnL as a percentage, entry price, and stop loss level. Active positions are re-evaluated by the monitoring engine on every new candle close — the display updates automatically.
Once a position is closed (by SL or TP), it moves to the Recent Trades section at the bottom of the page. Completed trades show the symbol, direction, entry price, exit price, and the final PnL percentage colored green (profit) or red (loss). Click any completed trade to immediately show the trade conditions that caused the position to open.
Use the Select All / Deselect All toggle and the Delete button to manage multiple alarm FT configurations at once. This is useful for cleaning up stale or inactive forward tests. Individual active trades can also be manually deleted from their respective alarm cards if needed.
5. Detailed Results View
Click Show Results on any alarm card to load the complete trading history for that specific alarm. The results view shows a pinned alarm summary at the top (direction, rules, SL/TP config), followed by per-symbol aggregate statistics — including the number of completed trades and win rate for each individual coin. This lets you quickly identify which assets perform best for this particular strategy.
Below the per-symbol breakdown, access the Full Trade History panel. It lists every single trade opened and closed by this alarm, sortable by date. Use the direction filter (LONG/SHORT/ALL) and outcome filter (Wins/Losses/All) to drill into the data. Each row is clickable — click a trade to view it directly on the chart.
6. Chart Visualization
Clicking any trade row — either active or completed — will automatically switch the chart to the trade's symbol and overlay the position visually. You will see the entry marker, stop-loss line, and take-profit line drawn directly on the candlestick chart at the exact historical timestamp. If the symbol needs to load, the chart will switch automatically and render the position after data is loaded. This gives you an instant visual understanding of exactly where, when, and why each trade was executed.
⚡ Key Principle: Forward Testing is designed to validate your backtested strategies in real market conditions before committing real capital. It runs 24/7 on our backend workers with zero browser dependency. Combined with Webhook and Telegram integration (next section), you can achieve a fully automated pipeline from signal detection to trade execution to mobile monitoring.
Beyond browser notifications, Plotwise enables you to route real-time Forward Testing signals to external systems. You can send automated HTTP POST requests (webhooks) to any URL, or receive instant formatted notifications in your personal Telegram bot. Both channels can be configured independently per alarm, and both can run simultaneously.
⚠️ Important: Webhook and Telegram notifications are dispatched only when a trade is actually opened or closed by the Forward Tester. This means the \"Auto-open positions\" toggle must be enabled in the FT configuration panel for these channels to fire. If auto-open is disabled, no trades are created and therefore no signals are sent.
1. How Signal Delivery Works
When a Forward Testing event occurs — a new position is opened (Entry), Stop Loss is hit, or Take Profit is reached — the system can automatically dispatch a signal through two independent channels: an HTTP Webhook and a Telegram message. You configure both channels inside the Forward Testing settings panel of any alarm. The same URL and bot configuration apply to all three signal types (Entry, SL, TP) for that alarm.
2. Webhook (HTTP POST) Setup
Navigate to the Alarms panel and click the Forward Testing Settings icon on the alarm you wish to configure. Scroll down past the SL/TP configuration to find the Webhook Alerts section.
Toggle ON the specific signals you want to receive via webhook. Each toggle independently controls one type of event:
• Entry Signal — Fires immediately when a new FT position is auto-opened on any matched coin.
• Stop Loss Signal ADV — Fires when an active FT position hits Stop Loss and is closed. Labeled Advanced because it is especially critical for Dynamic SL strategies where the stop level is recalculated from live indicator data.
• Take Profit Signal ADV — Fires when Take Profit is reached. Also labeled Advanced for Dynamic TP strategies.
Once any toggle is ON, a URL input field appears. Enter the full endpoint URL of your receiving server (e.g., https://api.example.com/webhook). Optionally, add a Secret Key — this will be included in both the request headers and the JSON body, allowing your server to verify that the request genuinely came from Plotwise.
Click the Send Test Webhook button. The system will fire a test payload to your URL and display the HTTP response status. A green checkmark confirms connectivity. If you see an error, verify that your endpoint is reachable and returns a 2xx status code. Remember to click SAVE SETTINGS after confirming the test succeeds.
3. Webhook Payload & Headers
Every webhook sends an HTTP POST request with a standardized JSON body. The payload is identical across all signal types, with the signal field identifying the event. Key fields include:
signal,
symbol,
direction,
price,
sl_price,
tp_price,
pnl_percent,
secret
In addition to standard Content-Type: application/json, every request includes two custom headers for easy routing and verification:
• X-Plotwise-Signal — Contains the signal type (ENTRY, STOP_LOSS, TAKE_PROFIT, or TEST) for quick server-side routing without parsing the body.
• X-Plotwise-Secret — Contains your secret key (if configured) for instant authentication verification.
4. Webhook Use Cases
Webhooks are the primary method for automated trade execution. You can connect Plotwise signals to virtually any trading infrastructure:
• 3Commas — Paste the DCA bot webhook URL directly. Plotwise will trigger new deals on Entry signals.
• Cornix — Use the Cornix webhook endpoint. The system parses symbol, direction, SL, and TP fields automatically.
• n8n / Zapier — Create a Webhook trigger node, paste the generated URL. Route signals to different workflows based on the signal type.
• Custom Python/Node.js Bot — Build your own receiver that calls the Binance API (or any exchange) to open/close real positions based on incoming signals. Example implementations are available in the developer documentation.
5. Telegram Bot Setup
Each user creates their own bot — Plotwise simply sends messages through it. This ensures you have full control over your notification channel. Open Telegram and find @BotFather.
1. Send /newbot to BotFather and follow the prompts to name your bot.
2. Copy the bot token (looks like 123456789:ABCdefGhIJklMNO...).
3. Send /start to your newly created bot (this activates it).
4. In Plotwise, toggle ON Telegram Alerts in the FT panel and paste your token.
After entering your bot token, click the Detect button. The system will automatically query the Telegram API to find the most recent chat where someone sent /start to your bot. It will populate the Chat ID field and display your Telegram username for confirmation. If auto-detection does not work, you can enter the Chat ID manually.
Click Send Test Message to verify the full pipeline. You should receive a beautifully formatted confirmation message in your Telegram chat within seconds. If successful, click SAVE SETTINGS to persist the Telegram configuration. From this point, every Forward Testing signal triggered for this alarm will be delivered to your Telegram.
6. Telegram Message Format
Telegram messages are professionally formatted with HTML for maximum readability. Each signal type delivers a distinct, detailed notification:
• 🟢 Entry — Shows symbol, direction (LONG/SHORT), entry price, SL & TP levels, alarm name, and timestamp.
• 🔴 Stop Loss — Shows symbol, entry → exit price, PnL percentage, and exit reason (Fixed SL, Dynamic SL, etc.).
• 🟡 Take Profit — Shows symbol, entry → exit price, profit percentage, and exit reason (Fixed TP, Dynamic TP, etc.).
7. Using Both Channels Together
Both notification channels run independently and can be enabled simultaneously on the same alarm. The recommended setup is: Webhook for automated execution (your bot opens real positions on the exchange) + Telegram for human monitoring (you see every trade event on your phone in real time). This dual approach ensures automated speed with full transparency — you always know what the system is doing, and you can intervene manually if needed.
💡 Pro Tip: Webhooks fire instantly upon signal detection (~100ms latency). Telegram messages typically arrive within 500ms. Both channels operate in a fire-and-forget manner — if a webhook endpoint is unreachable or Telegram delivery fails, the Forward Testing trade execution itself is not affected. Check PM2 process logs for debugging delivery failures.
The platform features a built-in background monitor for official Binance announcements. You can configure the system to instantly alert you when futures pairs are scheduled for delisting, allowing you to close positions on time or capitalize on news-driven drops.
1. How the Monitor Works
A dedicated server polls the Binance News API hourly for articles containing keywords like "futures" and "delist/removal". If a new announcement is found, the algorithm automatically extracts all affected trading pairs (e.g., USDT, USDC) directly from the text.
All you need to do to receive these signals is add an active alarm for BINANCE_DELIST in your Alerts Hub. The system will automatically find all users with this active alarm and push the notification or send it via Webhook/Telegram.
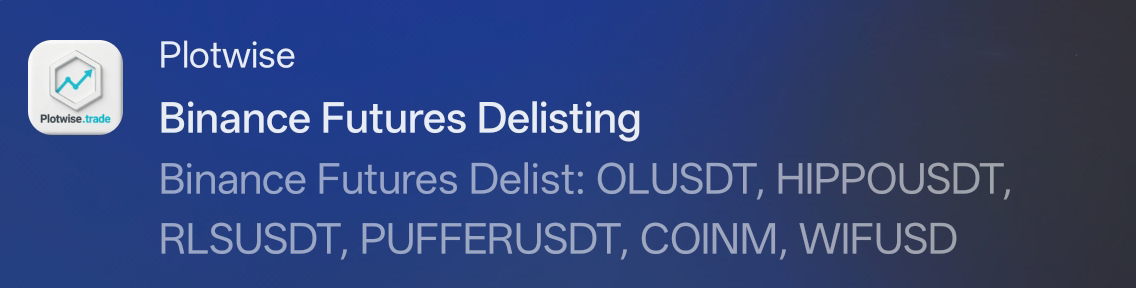
2. Notification Appearance
The notification will arrive with the extracted trading pairs, allowing you to instantly see which coins are affected without even reading the actual article on the Binance website. Below is a real example of such a notification delivered to a user:
The profile and settings section allows you to personalize the chart display and interface to your convenience.
1. Candle Close Time
Enable the Show candle close time on axis toggle to display a countdown timer for the current candle's close directly on the chart's price axis.
2. Entry Vertical Lines
Activate Show entry vertical lines in history mode to display thin vertical lines at exact entry points when viewing trade history, making it much easier to visually track completed trades.
3. Chart Distance
The Chart distance setting allows you to use your current zoom and Y-scale as default parameters for this device. Simply click Graph distance adjustment, and the current scale will be saved to your profile.
4. Oscillators on Collapse
The Oscillators on collapse option determines how many bottom oscillator panels (e.g., RSI, MACD) remain visible when collapsing multiple panels to save screen space. You can select from 0 to 5.
5. Customize UI Colors
Click the Customize button (next to the palette icon) to open the color editor. This allows you to change the accent colors for text, panel backgrounds, status boxes, and other platform interface elements (including hover effects), fully adapting the workspace to your personal taste.